Can you provide insight into how you work with product discovery?
Short answer: I learned to do research blending four sources of data-- existing data, qualitative, surveys & AB test results to develop consumer insight about how to delight customers.

Each month, I answer a few questions, drawing from my experience as VP of Product at Netflix and Chief Product Officer at Chegg (the textbook rental and homework help company that went public in 2013). Today’s answer is essay #55.
Here are my special offers and recent events:
Click here to purchase my self-paced Product Strategy course on Teachable for $200 off the regular $699 price — the coupon code is 200DISCOUNTGIBFRIENDS, but the link handles this automatically. (You can also try the first two modules for free.)
Here’s a podcast with Gtmhub. I discuss the blend of product strategy, consumer science, and culture required to build a world-class company.
UserLeap is now Sprig! They sponsor this product newsletter, letting me buy “Ask Gib” t-shirts, coffee mugs, and water bottles, which I pass on to “Ask Gib” subscribers for free. So, click on the Sprig survey link at the bottom of this essay — your feedback helps me a lot.
To ask and upvote questions, click here.
“Ask Gib” question: “Can you provide insight into how you work with product discovery?”
In 2005, during my first week as VP of Product at Netflix, I heard the phrase that product leaders fear most: “CEO Pet Project.” Reed Hastings, Netflix’s CEO, wanted previews on the Netflix site for 80% of the movies and TV shows that members watched. At the time, we were still a DVD by mail service, and Internet video was limited to postage-stamp-sized video. While we had 100,000 DVDs on our site, we had no previews.
There was lots of eye-rolling about the project among the product team. In focus groups, Netflix members complained that the only reason they watched previews was that they were a captive audience waiting for the movie to begin. They also complained that previews gave the story away or felt too much like an advertisement.
Previews were also hard to execute. Each week, we received cardboard boxes filled with thousands of previews in various formats. Some previews were on beta tapes, others on VHS, while a handful of studios expected us to “rip” previews from DVDs. Worse, the digital rights for previews were murky. Most previews played songs in the background, and the studios didn’t have the right to play the songs online.
Hypothesis: Movie Finding Tools Improve Retention
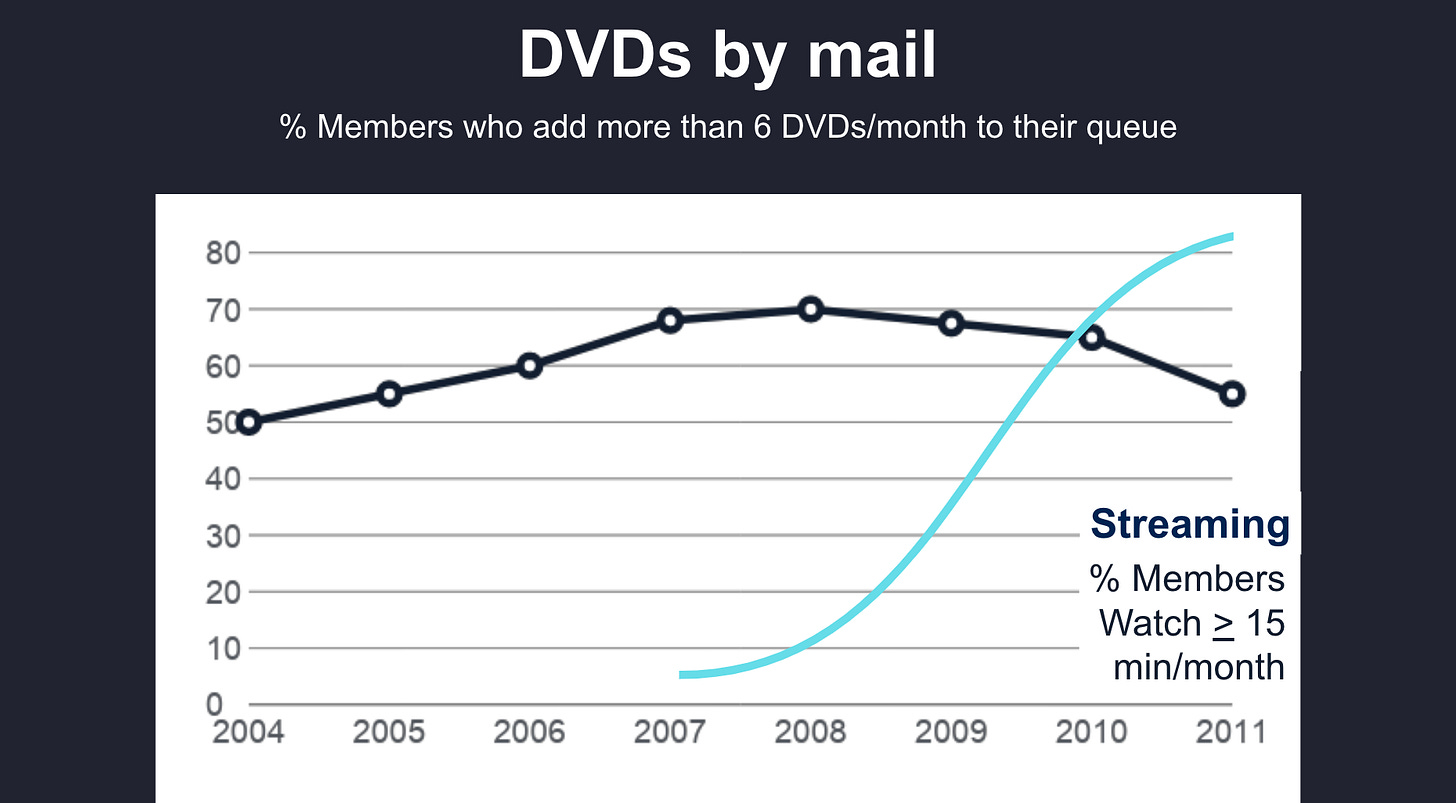
Reed believed that previews would improve our merchandising proxy metric. He hypothesized that previews would make it easier for members to find movies they love, driving our merchandising metric — the percentage of members who add at least six DVDs to their movie list each month— from 50% to 60%. Reed believed that growth in this proxy would lead to retention improvements.

We prototyped four approaches, resulting in four AB test cells:
We placed previews on 80% of the demand-weighted movie display pages. (We launched with an MVP of 50% of demand-weighted titles in an effort to reduce scope.)
We created a personalized movie preview interface that dominated the homepage of our site. This "Previews Machine” automatically played previews of movies we hoped they’d love. A member could add the title to their movie list or skip to the next recommendation.
We created a Previews tab. This tab provided access to the “Preview Machine” but the placement was less aggressive than the homepage takeover above.
We created a test cell with a Previews tab plus previews on all movie display pages. This test cell combined approaches from test cells one and three above.
We designed the test to answer two questions:
Would previews inspire members to add more DVDs to their movie list, and in the long-term, would unique movie-finding tools like the “Preview machine” improve retention?
We wanted to discover the extent to which we needed to build awareness and trial of previews to be effective. When new features fail, the most common complaint among product leaders is that customers are unaware of the feature. With the aggressive promotion of the feature on the homepage, we hoped to establish previews’ effectiveness with high awareness of the feature.
When we explored the prototypes in qualitative — in both focus groups and usability —we got poor feedback. Even more, when we asked members via survey, “Would your experience be better if the website had previews for all movies?” the response was negative, too.
But Reed was unwilling to quit the project, arguing that he didn’t care what a few dozen members said in focus groups or what thousands of members said in surveys. He cared more about how customers behaved than what they said. Reed wanted to understand whether previews would change customer behavior and the only way to answer this question was through an AB test. So as much as the product team wanted me to convince Reed to kill the project — based on the poor qualitative results — I committed to launching the four test cells.
The AB Test Results
We launched the four experiences, and the results were disappointing. Consistent with the qualitative, there was no evidence that the previews feature moved our DVD merchandising metric even with the aggressive homepage placement. Based on this failure, we lowered the priority of various movie-finding tools as hypotheses for retention improvements.
But we learned a lot along the way. One of the insights from the project was called “Back Of Box,” a feature that made it easier for members to evaluate their selection. Members could hold their cursor over the DVD title, and a layer would pop up displaying the information you’d typically find on the back of a DVD box. Members loved this feature, and unlike previews, “B.O.B.” was straightforward to execute.

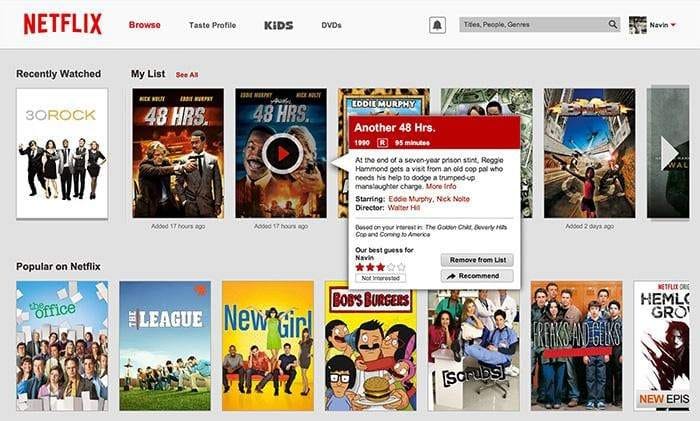
In the last five years, Netflix incorporated previews into its tv-based experience. Today, if you roll your cursor over the box art, a preview automatically begins to play. But it’s not the typical “spoiler” preview that you find in movie theaters. Instead, it’s a deliberate snippet of the tv show or movie that helps give a sense of the story without ruining it. Netflix makes it easy for members to make quick decisions about what they want to watch.
Four Sources of Data
The most crucial contribution of the previews experiment was to provide a rubric for the sources we used to evaluate ideas and how we made product decisions:
We used existing quantitative data to understand past and current behavior. We carefully monitored our DVD merchandising proxy metric to understand our ability to make it easy for members to find movies they’ll love. Our “percentage of members who add at least six titles to their movie list” metric improved until streaming began to dominate the service.
We did qualitative — focus groups, one-on-ones, usability, ethnography — to hear how people think and react to our work, along with a deeper insight into why they respond in specific ways. Through qualitative we understood why previews failed: they gave the story away or felt too much like advertising.
We executed surveys to capture who the customer is and how to think about their demographics, competitive product usage, entertainment preferences, etc. From time to time, we evaluated ideas via surveys to get a sense of potential with a larger population of customers.
Then we AB tested the hypotheses to see what worked. Once we committed to a project, we were careful not to use a data source other than AB tests to make “go/no-go” decisions about new products and features.
A Data Discovery Checklist
Today, I work with dozens of product teams around the world. In helping them to build a discovery capability — the ability to develop consumer insight— I provide this checklist:
Does your company have a set of “e-staff metrics” that defines your ability to create both customer and shareholder value? These metrics help you form hypotheses of how your product will delight customers in hard-to-copy, margin-enhancing ways. Do you have proxy metrics to evaluate new features or the effectiveness of new product strategies? Do these engagement metrics “ladder up” to your high-level engagement metric — like Netflix’s retention metric?
Do you have surveys indicating the demographics of your customers, why they leave, as well as a Net Promoter Score that gives a sense of your product’s overall quality? Do you have the ability to gather data from customers to build a trend line and identify mistakes quickly?
Do you have ongoing focus groups, one-on-ones, and usability sessions with customers? Does your team meet and talk with customers to develop your organization's “voice of the customer” on a weekly basis?
Do you have an A/B test capability that allows you to measure whether your ideas change customer behavior? Do these tools help develop your team’s intuition to form more robust hypotheses in the future?
Based on consumer insights and learnings, do you have a product strategy that defines your hypotheses about how you will delight customers in hard-to-copy, margin-enhancing ways?
Conclusion
The good news is that since the early days of Netflix, there are now lots of off-the-shelf tools to complete this data checklist. But today, like then, it’s still the case that trying things is better than debating or arguing about projects. With previews, Reed initially used his CEO trump card to initiate the project. But he eventually acknowledged he was wrong in the face of data— a great example of the team talking truth to power. But along the way, through both success and failure, we learned a lot about how to make it easier for Netflix members to find movies they’ll love.
One last thing!
Before you go, I’d love you to complete the Four Ss below:
1) Subscribe. As a subscriber, you’ll never miss an Ask Gib essay. I also provide Ask Gib members special access to unique content plus discounts on my Teachable Product Strategy Course.
2) Share this essay with others! By doing this, we’ll collect more questions and upvotes to ensure more relevant articles:
3) Star this essay! Click the Heart icon near the top or bottom of this essay. (Yes, I know it’s a stretch to say “star” and not “heart,” but I need an “S” word.)
4) Survey it! It only takes one minute to complete the Sprig survey for this essay, and your feedback helps me make this newsletter better: Click here to give feedback.
I hope you enjoyed this essay.
Best,
Gib
PS. Got a question? Ask and upvote questions here:
PPS. I have responded to 61 questions so far! (Once I answer a question, I archive it.)

Great story! Thanks for sharing. I once had an experience of getting data (user interview + survey) that told us not to proceed with an initiative. CEO wanted to launch it anyway. He was right. The feature was a success. People's discourse is often very different from action. We, humans, are quite irrational indeed.
Hey Gib, this was a great read. Surely learnt a lesson or two about data discovery. I have two questions, and would love for you to answer them. One, how did we establish merchandising metric as the proxy for retention? Did we have correlation data to support this? Second, what were the levers that contributed to the YoY growth of the merchandising metric till 2008, given the hypothesis Movie finding tools improve retention was proved wrong. I look forward to hearing from you :)